
This page provides you with granular details on how your pipeline of workflows evolved over a given time period.
For instance, which workflows have been completed last month ? How many and which ones were set to standby ?
In short: This page provides you with granular details on how your pipeline of workflows evolved over a given time period, for instance which workflows have been completed or set to standby.
In this article:
Page filters
- Pipeline: all metrics provided on the page are for a single pipeline
- Step: all metrics provided on the page are provided for a single step of the selected pipeline.
- Groups: select only the workflows that are currently linked to the selected groups.
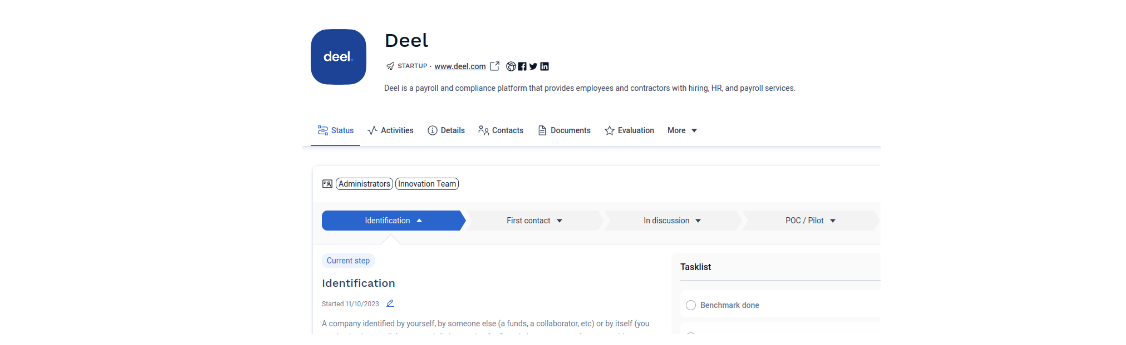
For instance in below picture the partner named Deel is linked to two groups, Administrators and Innovation Team.
- Tags: select only the workflows for which the partners/projects is attached to the selected tags.
- Labels: select only the workflows for which the partners/projects is attached to the selected labels.
- Leads: select only the workflows for which the partners/projects have the selected person as a lead.
For a given filter, when multiple selection is available, it behaves as a "OR" operator. For instance, if you select multiple tags, all items linked to at least one of the selected tags will be displayed. When multiple filters are combined, it behaves as an "AND" operator. For instance, if you select the tag "Renewable Energy" and the group "CSR Team", only items with the tag "Renewable Energy" and workflow linked to the CSR team will be displayed.
Evolution of in progress workflows
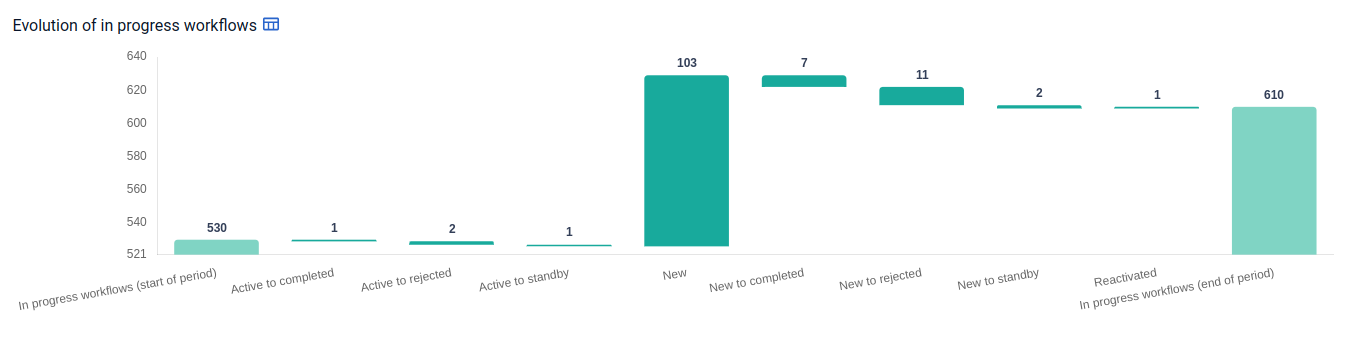
This waterfall helps you understand how your number of active workflows in your pipeline evolved between the beginning and the end of the selected time period. For instance, on the picture above, how you moved from 530 workflows in progress on Jan 1st 2023 to 610 on Nov 12th 2023.
The figures provided takes into account the start date recorded in your workflows, information that can be manually updated. Hence if you record a new workflow in the platform on April 2022 but record that it actually started in July 2021, this workflow will be counted in the stats from July 2021. That's the reason why you could see historical figures evolving, along with update you that are made to reflect as close as possible the real timings of your workflows.
- In progress workflows (start of period): Number of workflows that where in progress at start of the period, taken into account updates made on the workflows timeline.
- In progress to completed: Number of workflows in completion state at the end of the period that where in progress at the beginning of the period.
- In progress to rejected: Number of workflows in rejection state at the end of the period that where in progress at the beginning of the period.
- In progress to standby: Number of workflows in standby state at the end of the period that where in progress at the beginning of the period.
- New: Number of workflows that started during period.
- New to completed: Number of workflows that started during period and that are in state completed at the end of the period.
- New to rejected: Number of workflows that started during period and that are in state rejected at the end of the period.
- New to standby: Number of workflows that started during period and that are in state standby at the end of the period.
- Reactivated: Number of workflows that started before the beginning of the selected period, that where not in progress at the beginning of the period but are in progress at the end of the period.
- In progress workflows (end of period): Number of workflows that are in progress at end of the period, taken into account updates made on the workflows timeline.
The chart data are based comparing data between two dates only: the start and the end of the selected period. Hence, if a workflow was set to standby and then to rejected during the selected period, it will only appear in the columns "In progress workflows (start of period)" and "In progress to rejected". The workflow will not be counted in the column "In progress to standby".
Drill down:
Drill down is available on all bars excluded the number of workflows at start and end of period.
- Item name: name of the partner to which the workflow is linked to
- Groups: All groups currently linked to the workflow
- Leads: list of all partners' internal contacts defined as lead.
Average daily in progress workflows
Average daily in progress workflows for the selected time period.
Daily in progress workflows over period
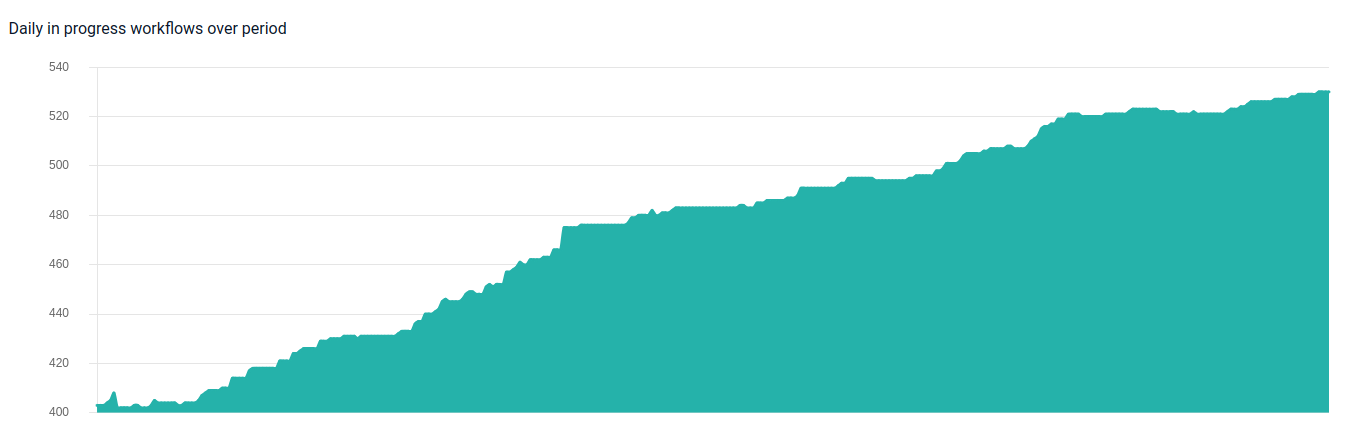
Number of in progress workflows per day over the selected period.
Average daily in progress workflows per group
This graph let you assess which groups where had to handle most in progress worklows during the selected period, at how this evolved compare to the previous period.
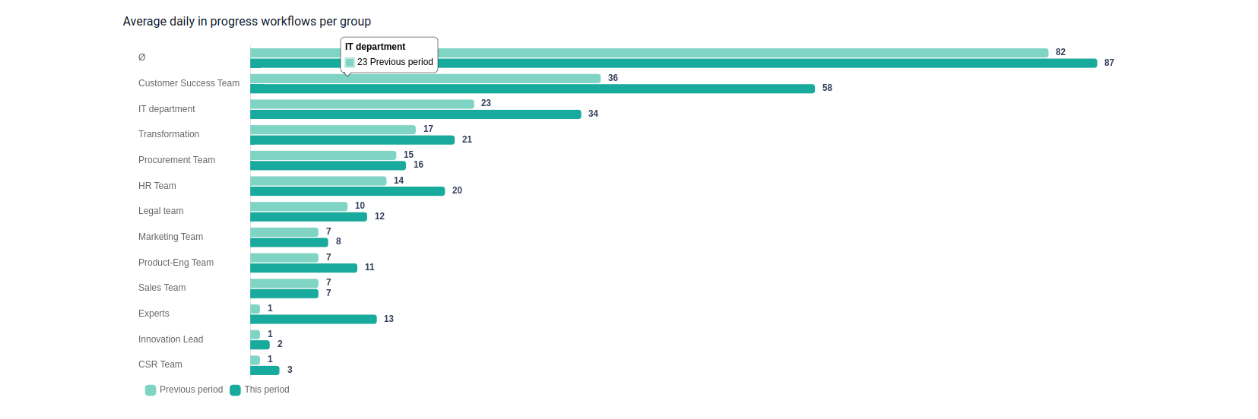
Average number of daily workflows currently attached to a given group for the selected time period, compare with the previous period.
Comments
0 comments
Please sign in to leave a comment.